
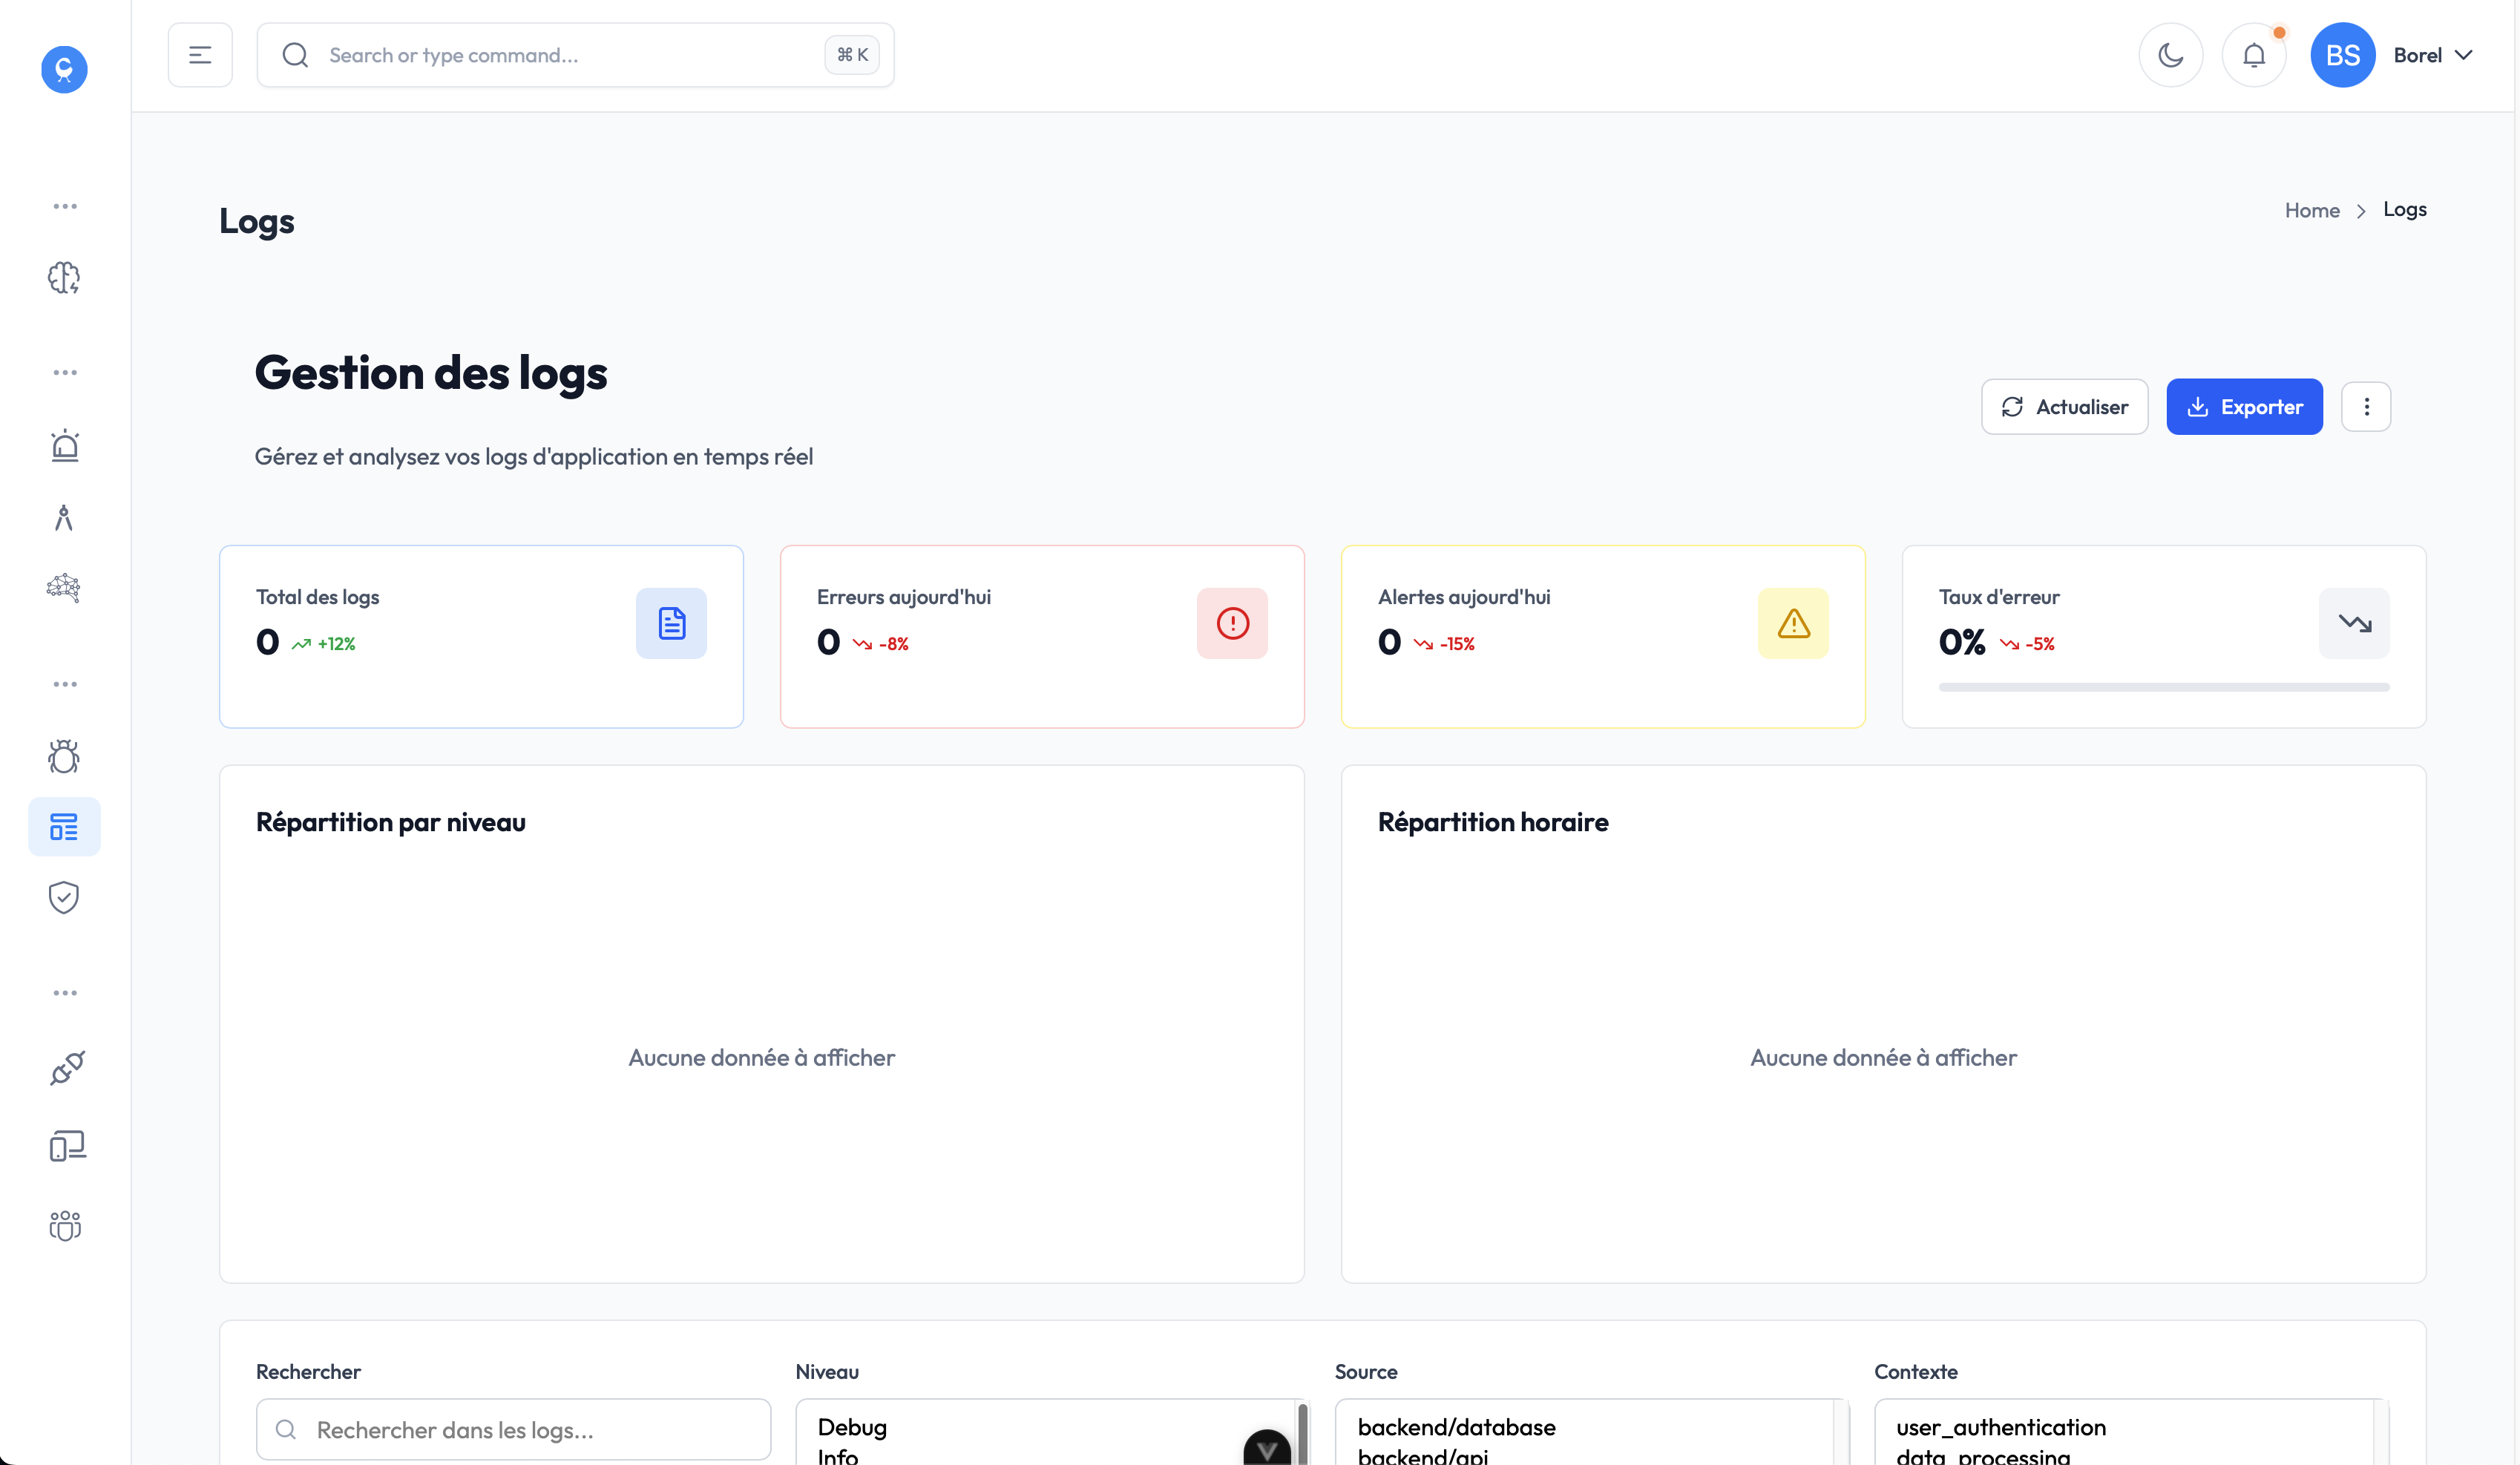
In modern micro‑service environments, error visibility alone is insufficient. Teams need latency context, trace correlation, and SLA monitoring to keep MTTR low and uptime high.
Quick Comparison Table
| Criteria | Sentry (Error‑Centric) | Lescopr (Full‑Stack Observability) |
|---|---|---|
| Primary Focus | Exception capture, stack traces | End‑to‑end tracing, logs, metrics, SLA dashboards |
| Latency Insight | Limited – only response‑time tags if manually added | Automatic latency aggregation across services |
| Trace Correlation | Manual linking via SDKs | Native OpenTelemetry integration, auto‑correlated traces |
| SLA Monitoring | No built‑in SLA alerts | Custom SLA dashboards with breach notifications |
| Pricing Model | Tiered per‑event pricing, extra cost for high‑volume traces | Consumption‑based, includes traces, logs, and metrics in one price |
| Learning Curve | Low for basic error tracking, higher for advanced trace setup | Moderate – unified UI but requires initial instrumentation |
| Support | Community + paid support tiers | Dedicated SRE‑focused support, 24/7 on‑call option |
| MTTR Impact | Improves incident detection but often requires separate tools for root cause | Reduces MTTR by providing full context in a single platform |
Why Latency Matters More Than Errors Alone
When an exception is logged, the immediate question is "What went wrong?" However, in distributed systems the real question often is "Why did it take longer than expected?"
- Latency spikes are early indicators of downstream bottlenecks, resource exhaustion, or network issues.
- SLA compliance depends on response‑time thresholds, not just error counts.
- MTTR improves dramatically when engineers can see latency trends alongside stack traces.
Sentry excels at surfacing the exception, but it does not automatically surface the latency context that leads to SLA breaches. Lescopr, by contrast, aggregates request latency across every hop, correlates it with traces and logs, and surfaces SLA violations in real time.
Feature Deep‑Dive
1. Automatic Trace Correlation
- Sentry requires developers to manually attach trace IDs to events, and the correlation UI is limited to a single service view.
- Lescopr ingests OpenTelemetry data out‑of‑the‑box, stitching together spans from API gateways to databases. Engineers can drill from a high‑latency request straight to the offending span, reducing investigation steps.
2. Unified SLA Dashboards
- Sentry offers basic alerting on error rates but lacks native SLA threshold monitoring.
- Lescopr lets you define SLA thresholds (e.g., 95 % of requests < 500 ms) and visualizes breach trends alongside error spikes. When a breach occurs, a combined alert includes the offending trace and log snippet.
3. Pricing Transparency
- Sentry charges per event and adds extra fees for high‑volume trace ingestion, which can become unpredictable for busy services.
- Lescopr provides a single consumption‑based price that covers errors, traces, logs, and SLA dashboards, simplifying budgeting for SRE teams.
4. Support for Multi‑Stack Environments
Both platforms support Java, Node.js, Python, and Go, but Lescopr’s observability‑first approach includes built‑in dashboards for Kubernetes, serverless, and legacy monoliths, reducing the need for third‑party add‑ons.
Verdict and Recommendation Matrix
| Use‑Case | Recommended Tool |
|---|---|
| Pure error tracking with low traffic volume | Sentry (basic tier) |
| Need for latency‑aware incident response | Lescopr |
| Strict SLA compliance monitoring | Lescopr |
| Budget‑sensitive teams with predictable pricing | Lescopr |
| Teams already invested heavily in Sentry’s SDKs | Sentry (if latency not critical) |
Overall, if your organization’s reliability goals hinge on latency visibility, MTTR reduction, and SLA adherence, Lescopr provides a more comprehensive, cost‑predictable solution.
Next Steps
Before choosing your tool, compare with Lescopr on concrete technical criteria — free trial available.
Reading time: ~6 minutes
Feature Image Alt Text: "Engineer reviewing a multi‑service observability dashboard with latency graphs"